
PerfView
Analyze ETW and CLR data efficiently
Description
PerfView is a powerful diagnostic tool that enables developers to investigate ETW information from ETL files and CLR memory data from heap dumps. It provides a user-friendly environment for collecting, analyzing, and visualizing performance data, with a strong focus on CPU performance. Quickly identify bottlenecks, memory leaks, and system issues through intuitive views and deep analysis capabilities, making it easier to optimize application performance and resolve complex problems.
Screenshots
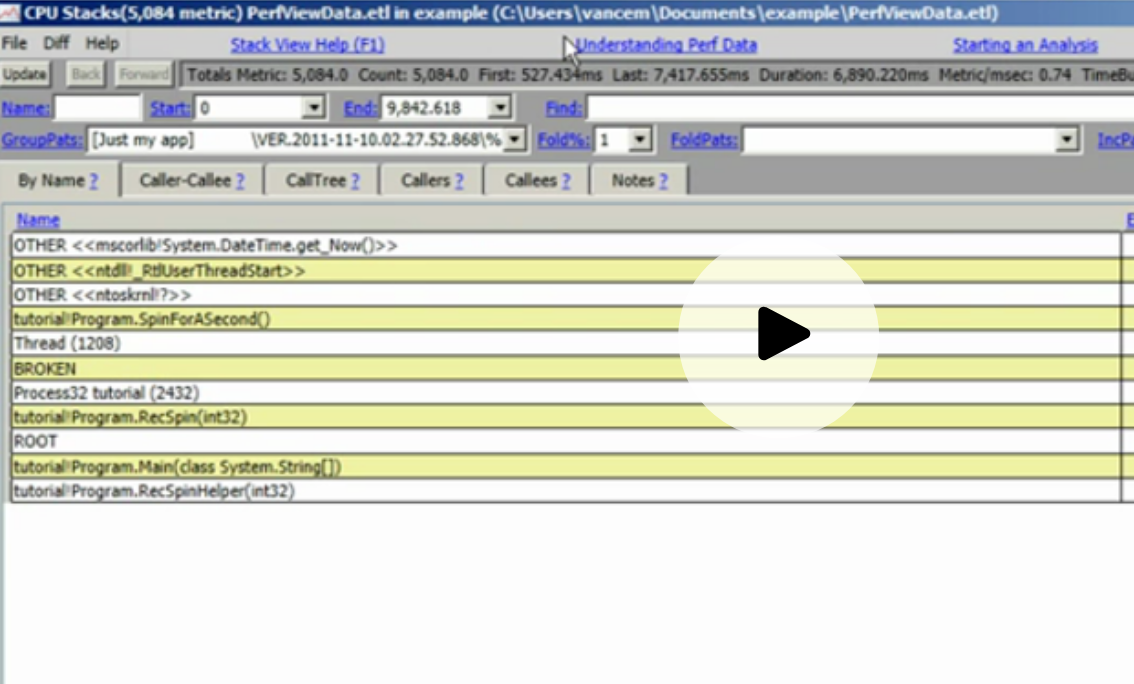
Click to view full size